

Intensity colocalization analysis in napari
Background
Colocalization analysis, which quantifies how the intensities of two fluorescence channels co-vary across an image, is one of the most common questions we get asked about at the IACF. The methods are well established and excellent reference implementations exist, among them the Coloc 2 plugin in ImageJ/Fiji and the scikit-image colocalization metrics. What we found ourselves missing was a comparable workflow for users who already work in napari, particularly when the analysis needs to be restricted to specific regions of interest, and when the output needs to flow naturally back into a Python-based analysis pipeline.
We decided to put together a small plugin that fills this gap. We hope this plugin will reduce the time we and our users spend on routine colocalization questions.
Plugin functionality
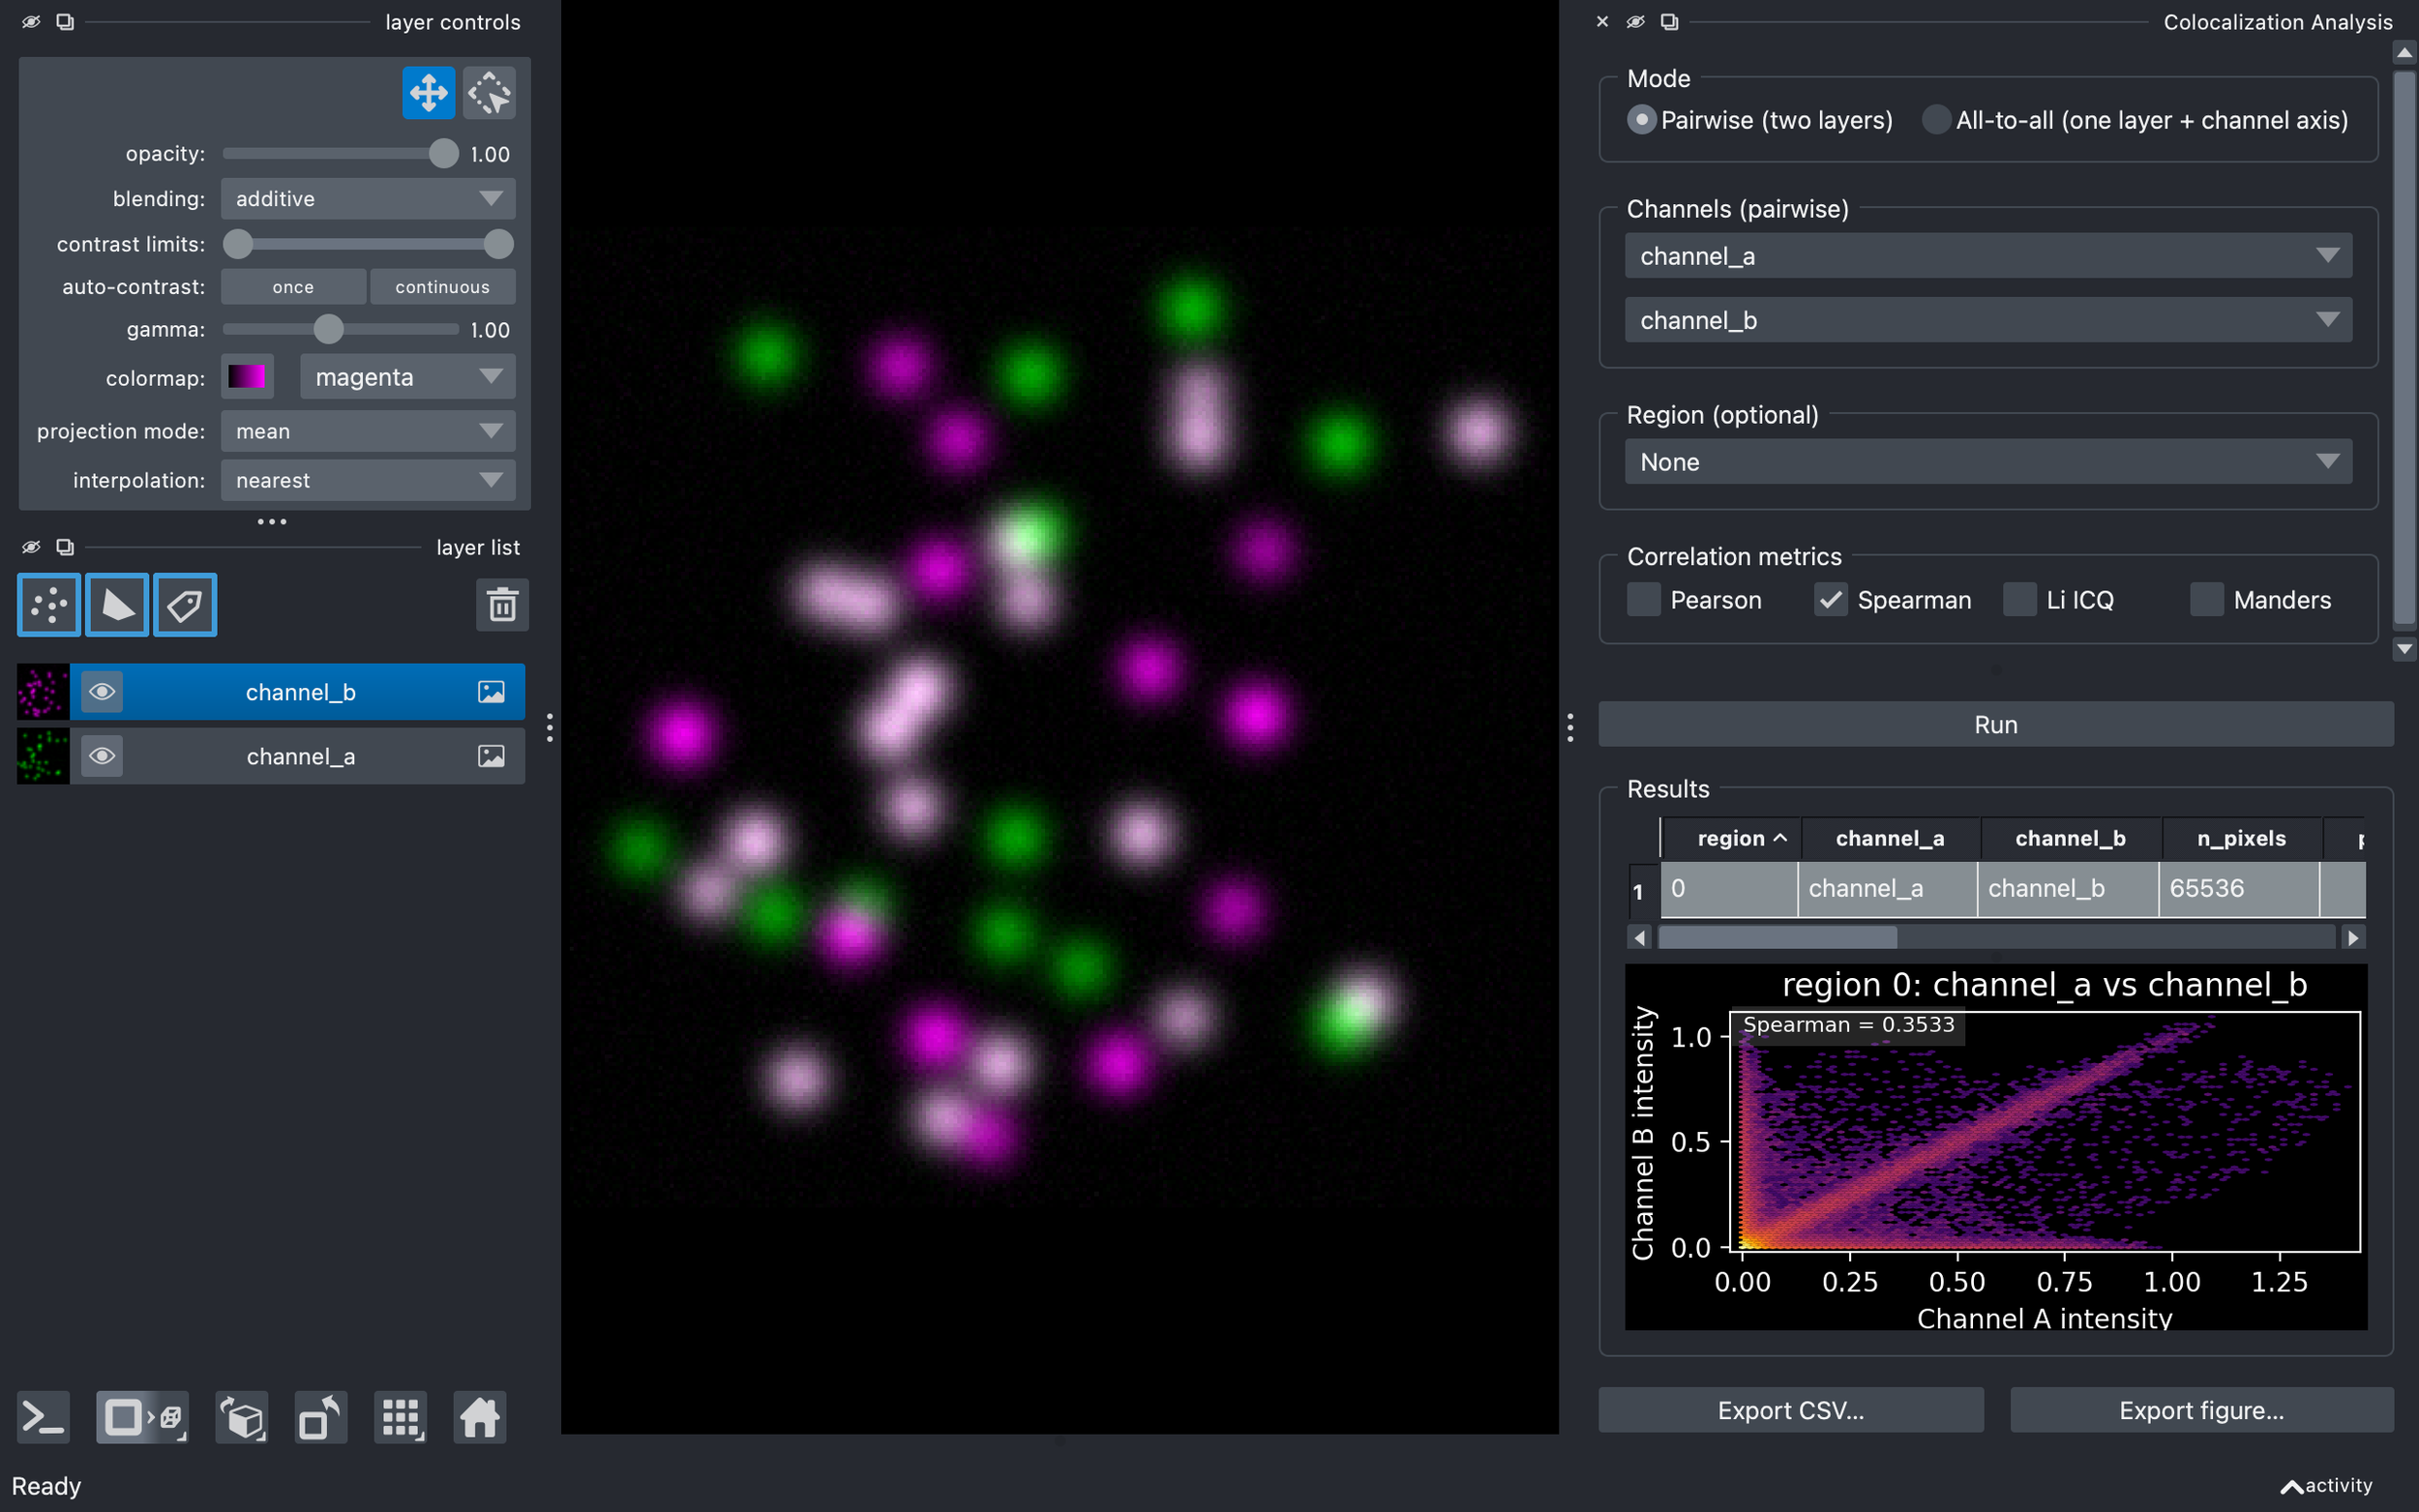
napari-colocalization is a napari plugin that lets the user pick two channels (or a single multi-channel image), optionally restrict the analysis to one or more regions, choose a metric, and get back a results table together with an intensity-vs-intensity density plot.
The current feature set covers:
Four correlation metrics: Pearson (PCC), Spearman rank (SRCC), Li's Intensity Correlation Quotient (ICQ), and Manders' coefficients M1/M2 (MCC), with thresholds set either manually or via the iterative Costes auto-threshold.
Pairwise or all-to-all mode: analyse two grayscale layers, or every channel pair within a single multi-channel layer.
Region-restricted analysis: each non-zero shape or label is reported on its own row, and selecting rows in the table highlights the matching regions in the viewer.
2D and 3D support out of the box (time-series support is not yet implemented).
Export: CSV export of the results table, and figure export of the density plot.
A pure-compute Python API that can be called directly from scripts or notebooks, independently of the GUI.
Impact
The plugin is currently in active development. We are publishing it early to gather feedback from real use, and to make it easier for user to try it out and tell us what they would like to see improved.
That said, we expect that even at this stage it can already shorten the path from "I have a multi-channel image open in napari" to "I have a defensible colocalization measurement and a figure", especially for analyses that involve drawing or segmenting regions of interest.
Further links
Documentation: https://dbi-infra.github.io/napari-colocalization/
Source code: https://github.com/DBI-INFRA/napari-colocalization
Napari Hub: https://napari-hub.org/plugins/napari-colocalization